Due to varying climates, life-styles, industries, and day light hours, electricity use around the world varies significantly. The video above shows the hourly electricity demand in 2019 (UTC) for over 100 geographic regions. The load of each area is scaled to a percentage of its maximum load (therefore absolute values are not shown) and the grey shaded area shows the areas that are in darkness at that time. In most cases, the raw load data is used, but for China and India the hourly load was inferred based on daily maximum/minimum and energy data.
While (I think) the video looks really cool, it is difficult to observe patterns while it is moving so fast, so this post contains some static analysis of the varying electricity usage.
From the video, it can be seen that electricity demand is generally higher during daylight hours. However, the point in the day when the peak occurs in each area will depend on the way they use electricity. For example, if heating and cooking are dominant loads then peak demand is likely to be in the evening (local time). Whereas, if cooling is the dominant load, then peak demand will occur in the middle of the day when the temperature is highest. The map below shows the peak demand hour in UTC of each area, averaged over the entire year.

Although there is a general trend that the peak gets later as you move west, there are also a number of other factors at play. Firstly, some areas use a time zone which is not strictly consistent with their latitude; for example Argentina uses the same time zone as Brazil despite being much further west, and China uses only one timezone. Also, in places where industrial load is large comparative to residential load, the peak demand is more likely to be in the middle of the day.
The seasonal variation in electricity demand is more strongly linked to climate. In hot areas where electric air-conditioning is widespread the peak demand is likely to be in the summer (note that the seasons are reversed in the southern hemisphere). Whereas in cold climates with wide-spread electric heating the peak demand is likely to be in the winter. In many areas gas heating is still wide-spread, so some areas in cold climates may have unexpected seasonal peak demand. In areas with more dominant industrial land, the peak load may be determined by seasonal production. The peak electricity consumption month of each region is shown below.

Residential load tends to be more variable than industry demand, both diurnally and seasonally. Therefore quantifying the variability of demand can allude to the dominance of industrial load. One such metric is load factor, which gives the ratio of the average demand to the peak demand. This means that an area with a completely flat load profile would have a load factor of 100%. The load factor for each area is shown below.

The highest load factors on this map are within countries broken down into multiple geographic electricity regions (e.g. in China, Canada, and Brazil). This may be because in larger countries manufacturing is often moved to areas with a low population density (for cost reduction). The higher load factors are also predominately seen in areas with a relatively small climate variation throughout the year.
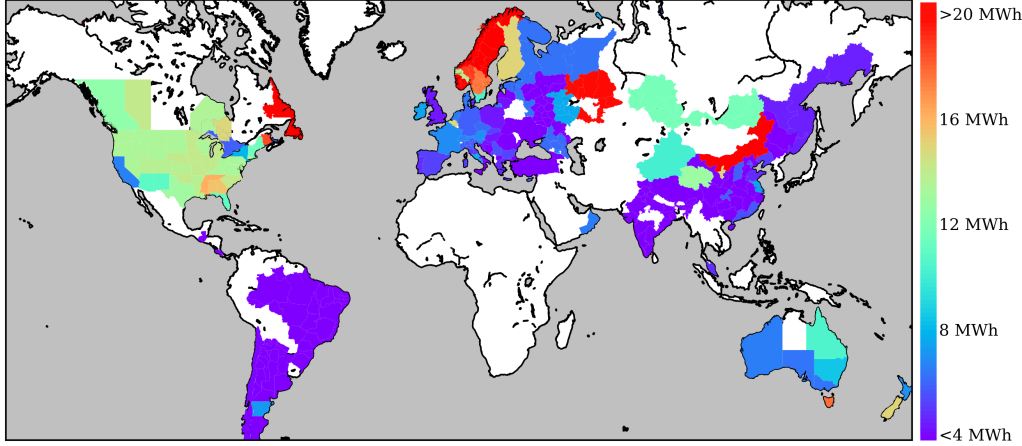
Finally, the animation and the static analysis so far all show information about the electricity demand profile, but not its size. The final map shows the annual electricity consumption per capita of each geographic region. This demonstrates the significant variation in energy usage across the world. High population density, low industrial demand, and access to other energy sources (e.g. gas) are all factors that can contribute to a lower electricity consumption per capita.
Disclaimers: The quality of this data is limited by both the sources and my skill in adjusting it. If you spot any inaccuracies, or have hourly transmission load for a region not covered, please let me know.
